
Coronavirus Sonifications
"...We All Fall Down" | UK Coronavirus | A listening journey | Durational performance | Livestream | Electric Dreams Festival 2020
Percussive Sonification - Every UK Covid 19 Death by Day - from March 5th 2020 to June 23rd 2020
Harmonic Sonification - England Covid 19 Deaths by Day from March 1st - Updated June 12th 2020
First Wave | A sonification of deaths from Coronavirus in the UK over 154 days, from 2nd March to 2nd August 2020 | BEAST FEaST 2021
(This is a consolidation of
"...We All Fall Down" | UK Coronavirus | A listening journey,
originally commissioned by Crossover Labs)
A sonification of deaths from Coronavirus in the UK over 154 days, from 2nd March to 2nd August 2020. Includes soundscapes from before, during and after lockdown, and interviews with UK people, from frontline workers to near death survivors. Duration: 10 hours 20 minutes.
"...We All Fall Down" | UK Coronavirus | A listening journey
| Durational performance | Livestream | Electric Dreams Festival 2020
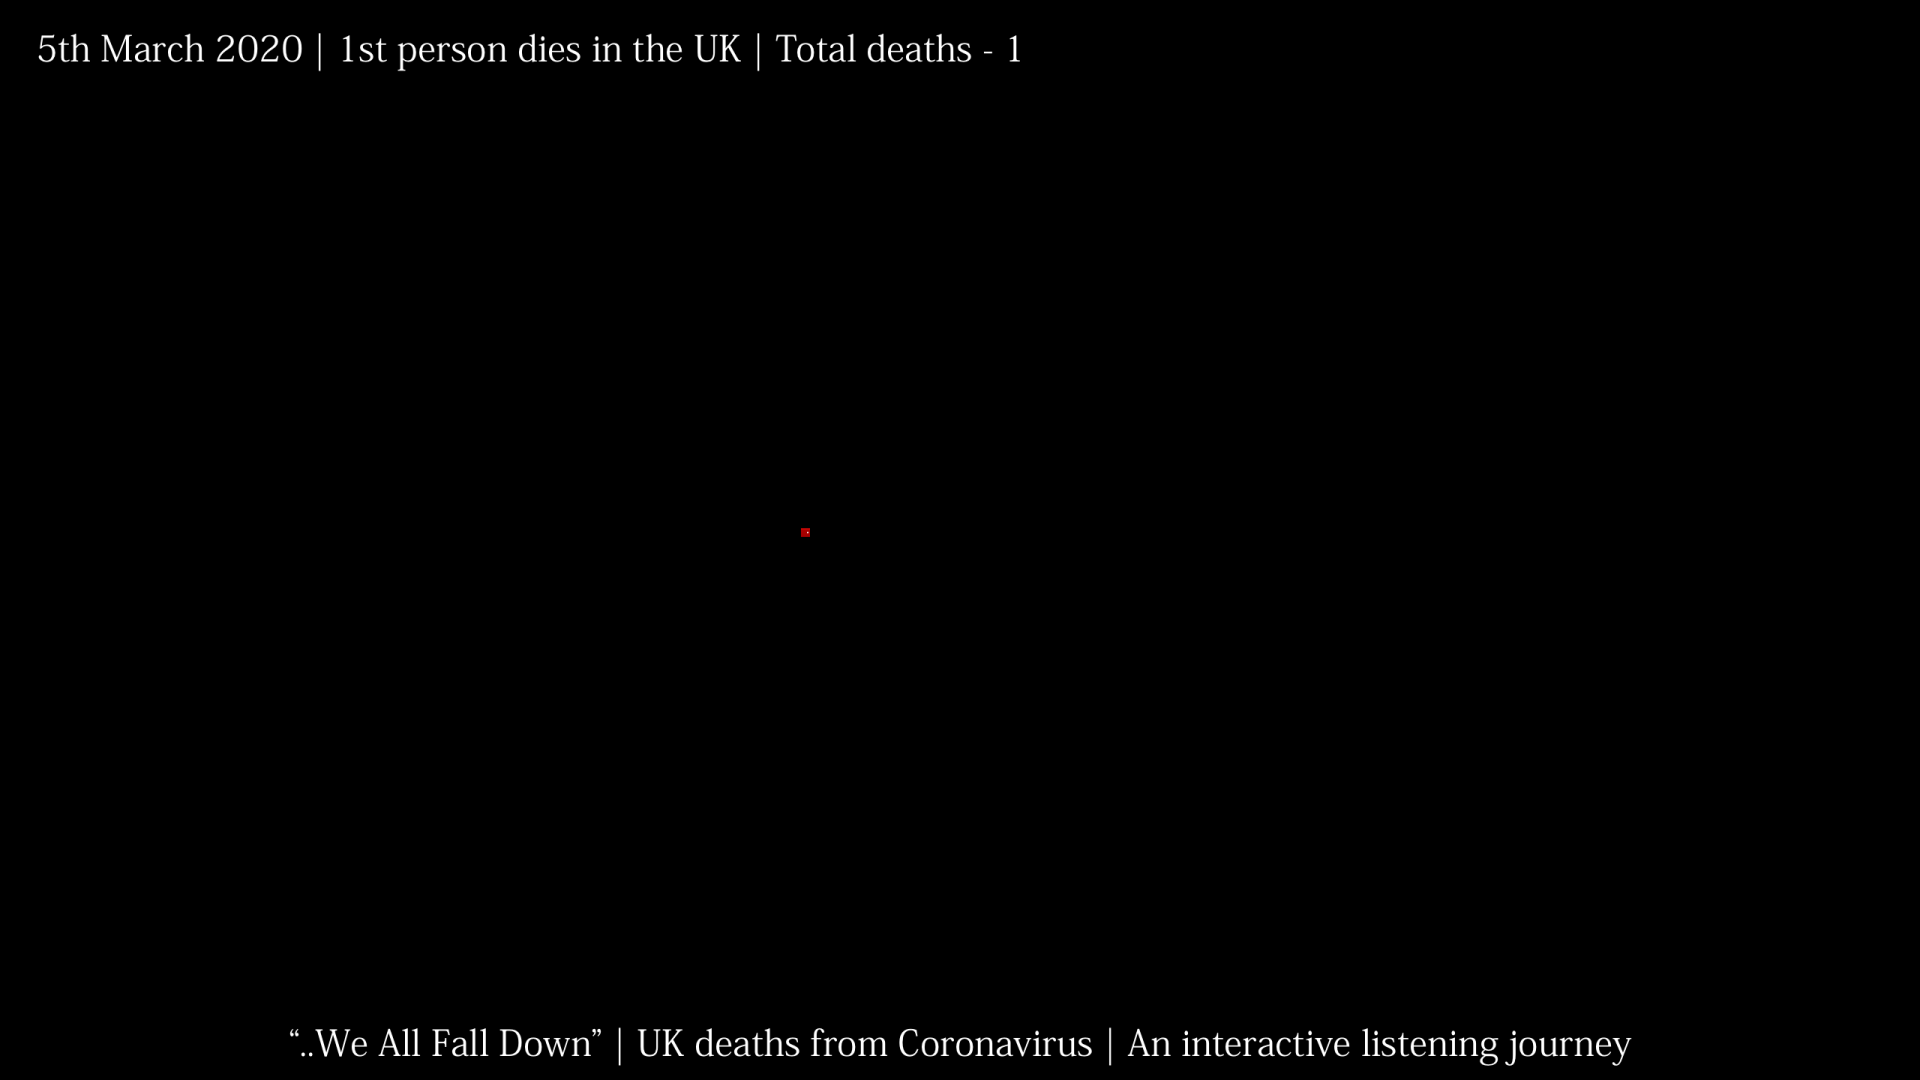
An interactive listening journey through work sonifying every Covid-19 related death in the UK, inviting us to reflect and share experiences as we move along the piece's timeline from the first UK death on March 5th 2020 to August 16th 2020.
The work incorporates
- over 20 hours of testimony from interviewed individuals, from frontline workers, to self-isolating vulnerable people, to near death survivors.
- soundscapes following the timeline, from conversation in pubs, planes overhead and school playgrounds to empty streets, footsteps in isolation, hospital ICUs and environmental sounds without humans.
- a sonification of every Coronavirus death from March the 5th to August 16th 2020.
The work is experienced in extended performances spanning a curated time period, such as a programmed week of installation, or the duration of a festival. Listeners are invited to tune into a sonic timeline that provokes us to re-examine our recent past, re-live stories of human spirit and suffering, and gain perspective on actions that have and could have made a difference in the UK's battle with Covid 19. In some cases, listeners’ shared thoughts and personal accounts of experiences with Coronavirus are recorded, and become a permanent part of Jamie's ongoing sound work.
"...We All Fall Down" has been featured as part of Burning Man Multiverse 2020, and Electric Dreams Festival 2020.
Electric Dreams 24 day performance (periscope stream): Part one | Part two | Part three | Part four | Part five
Visual excerpts:
Sonification - Every UK Covid 19 Death by Day - from March 5th 2020 to June 23rd 2020
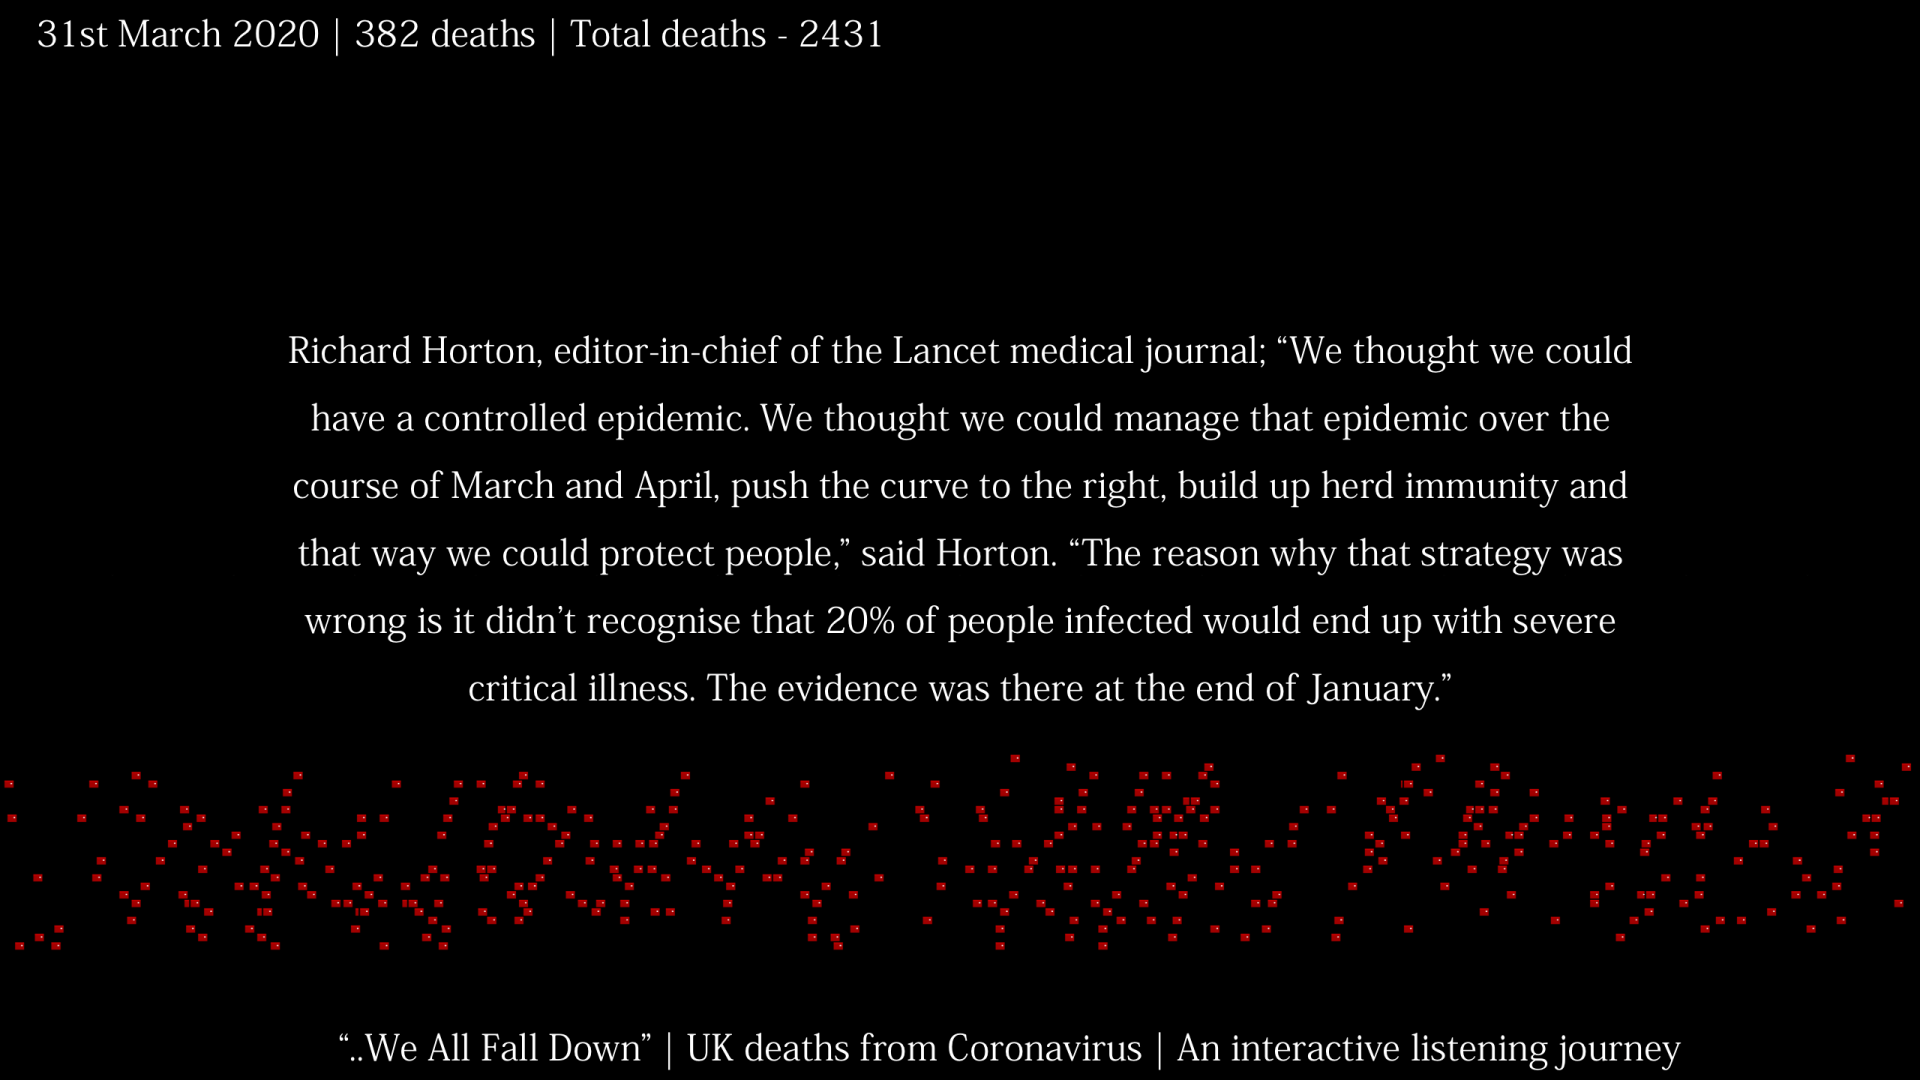
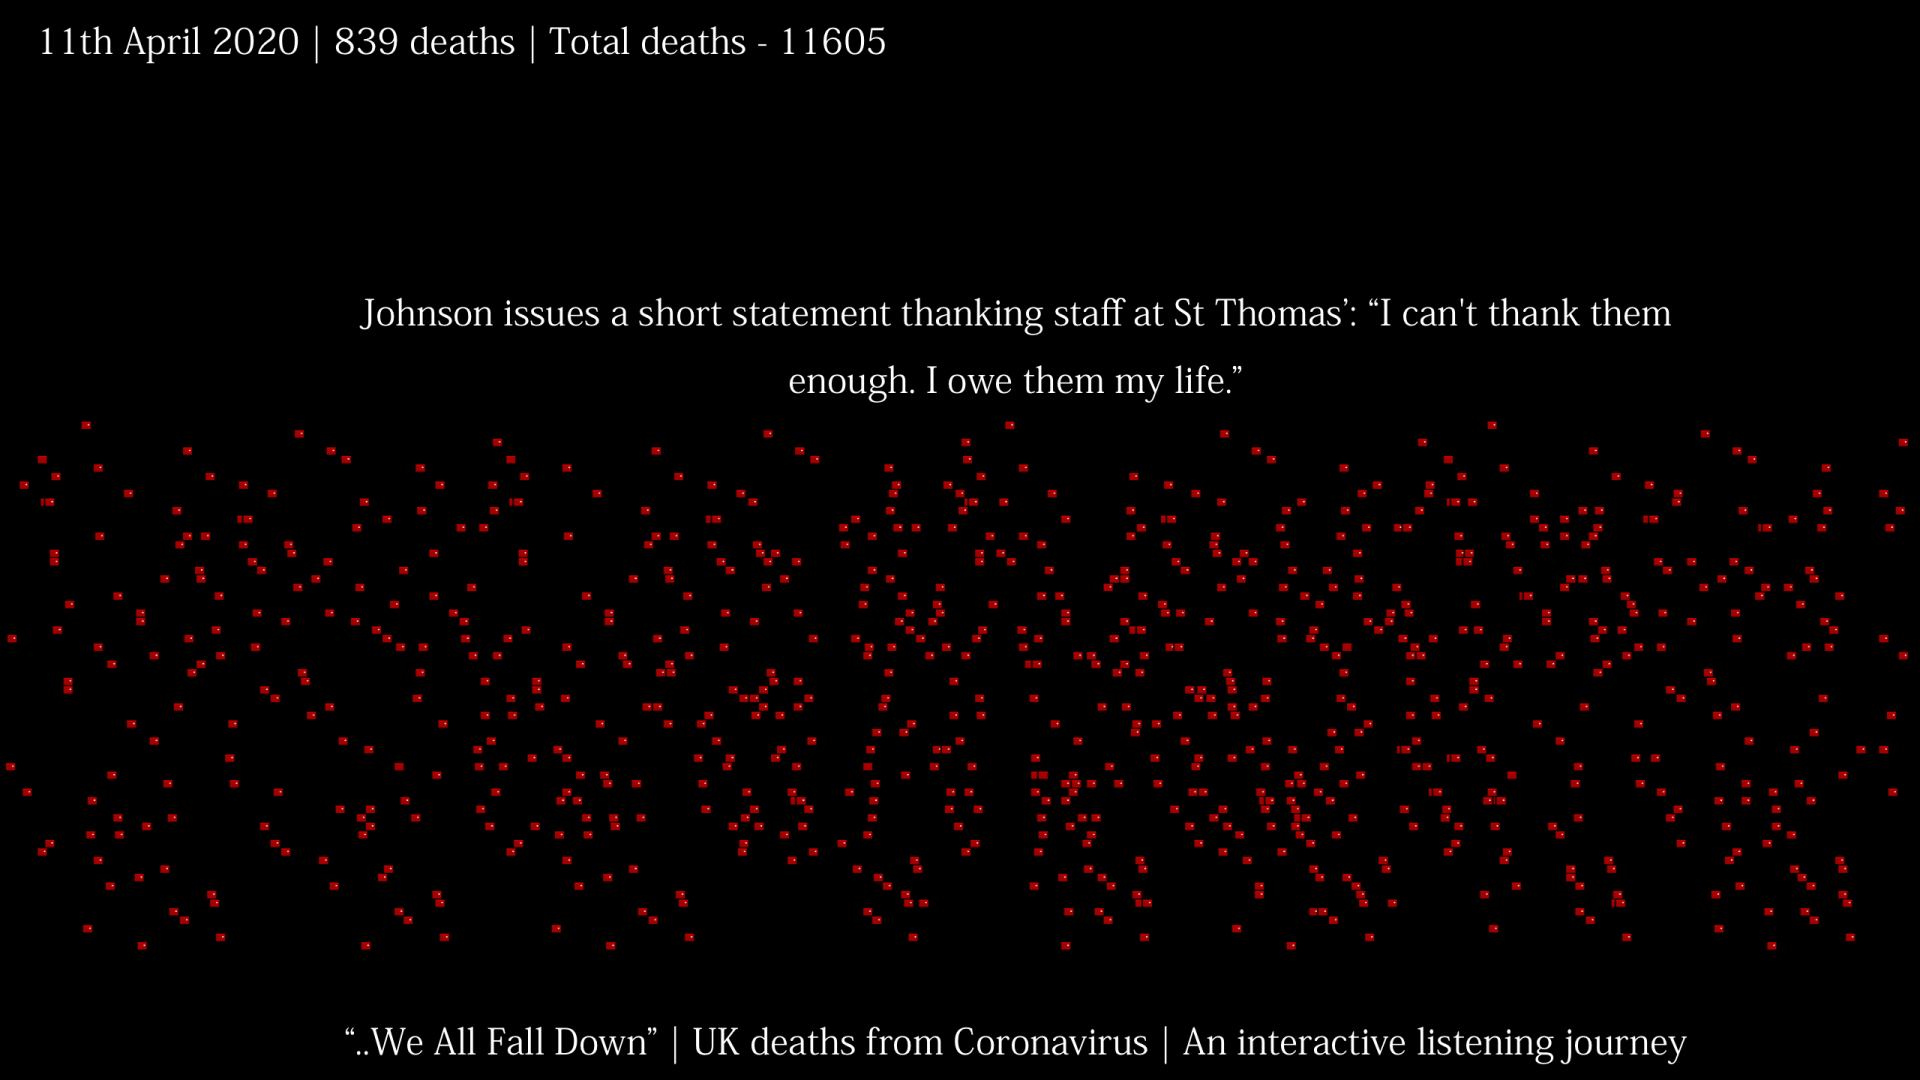
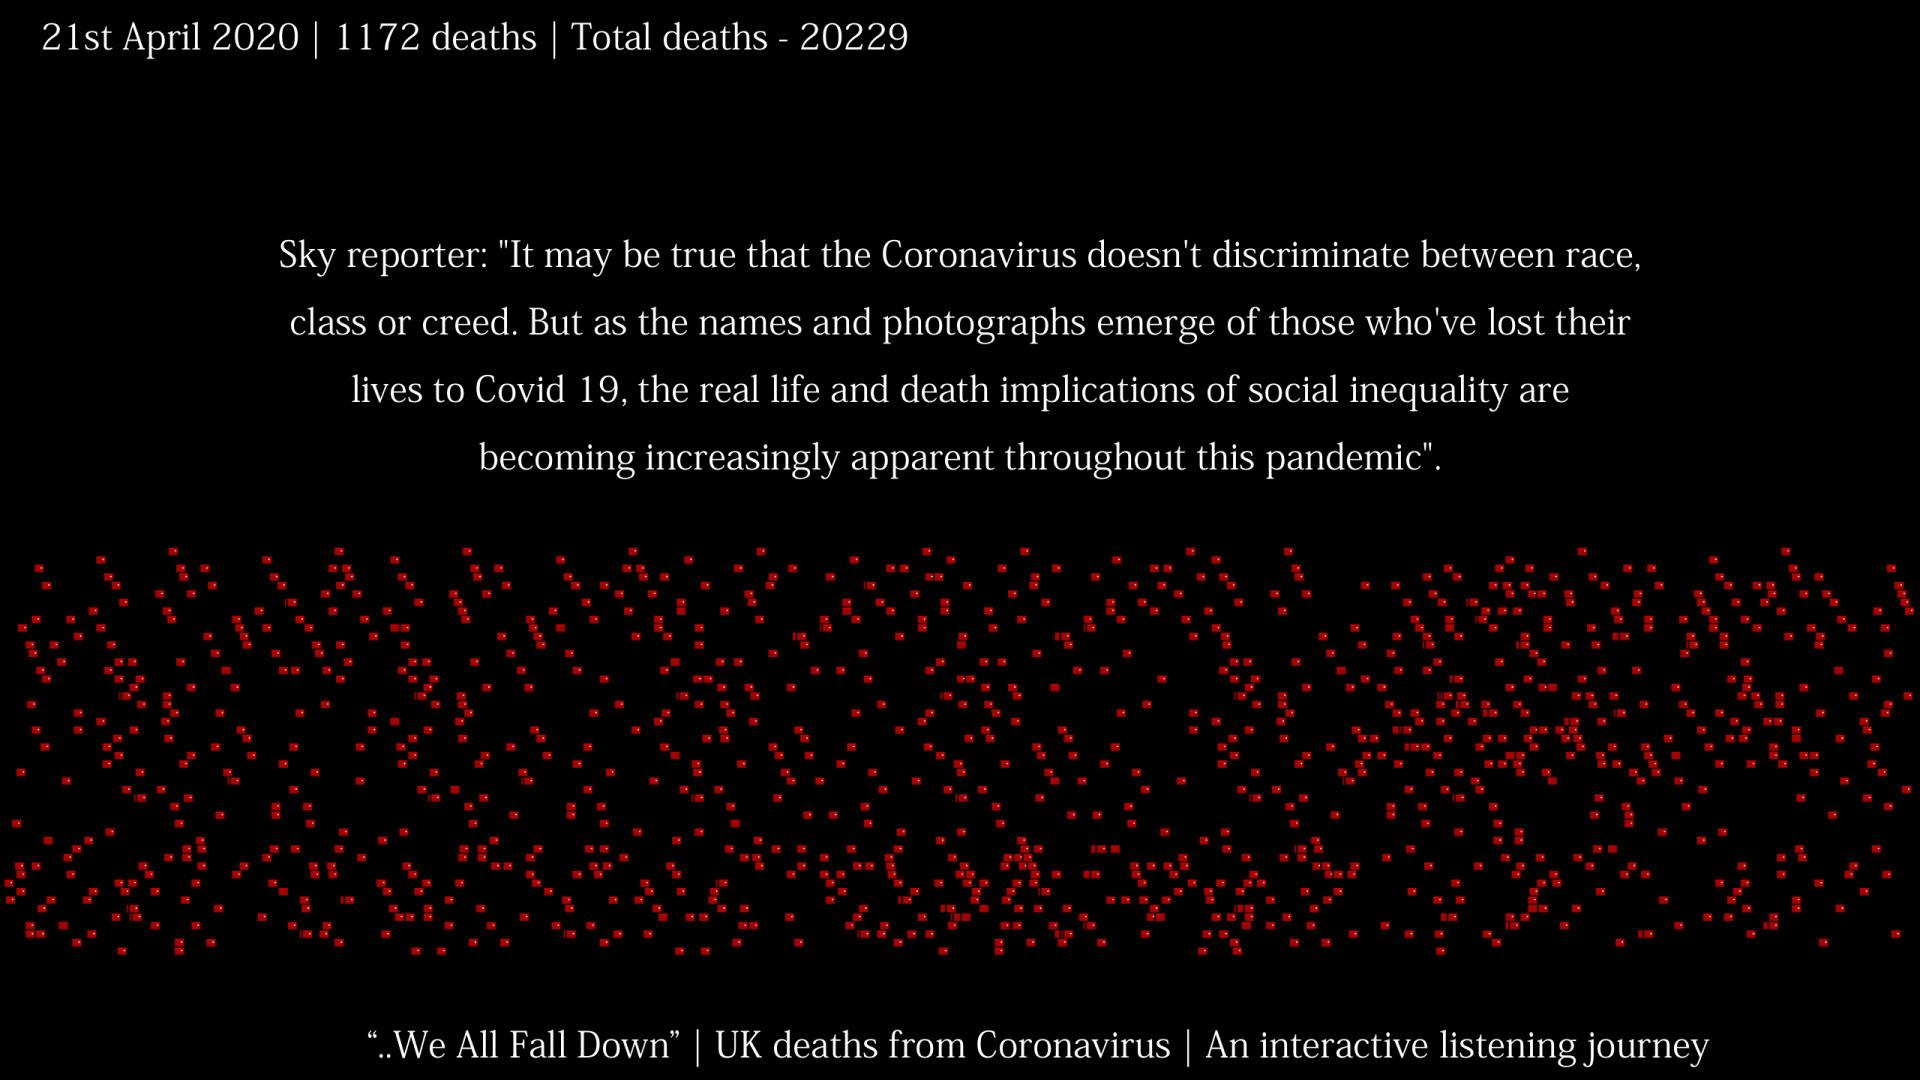
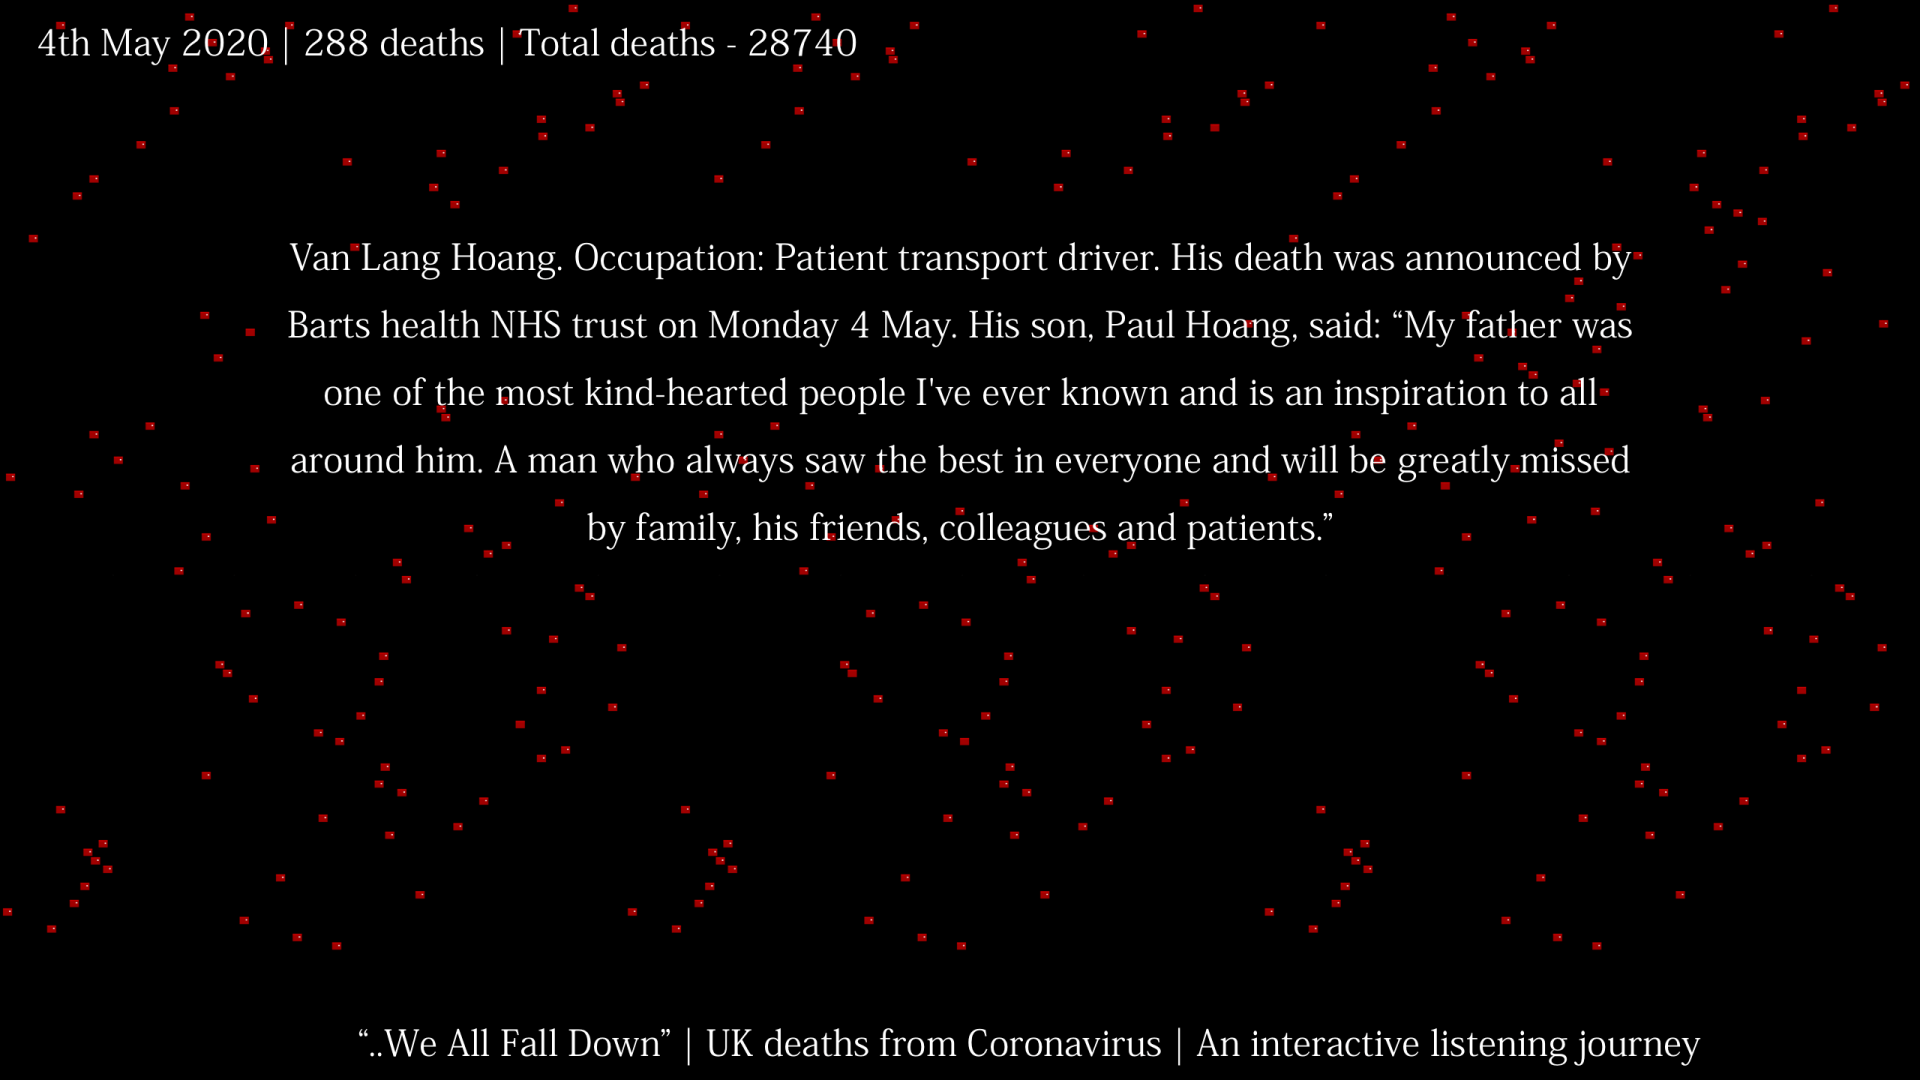
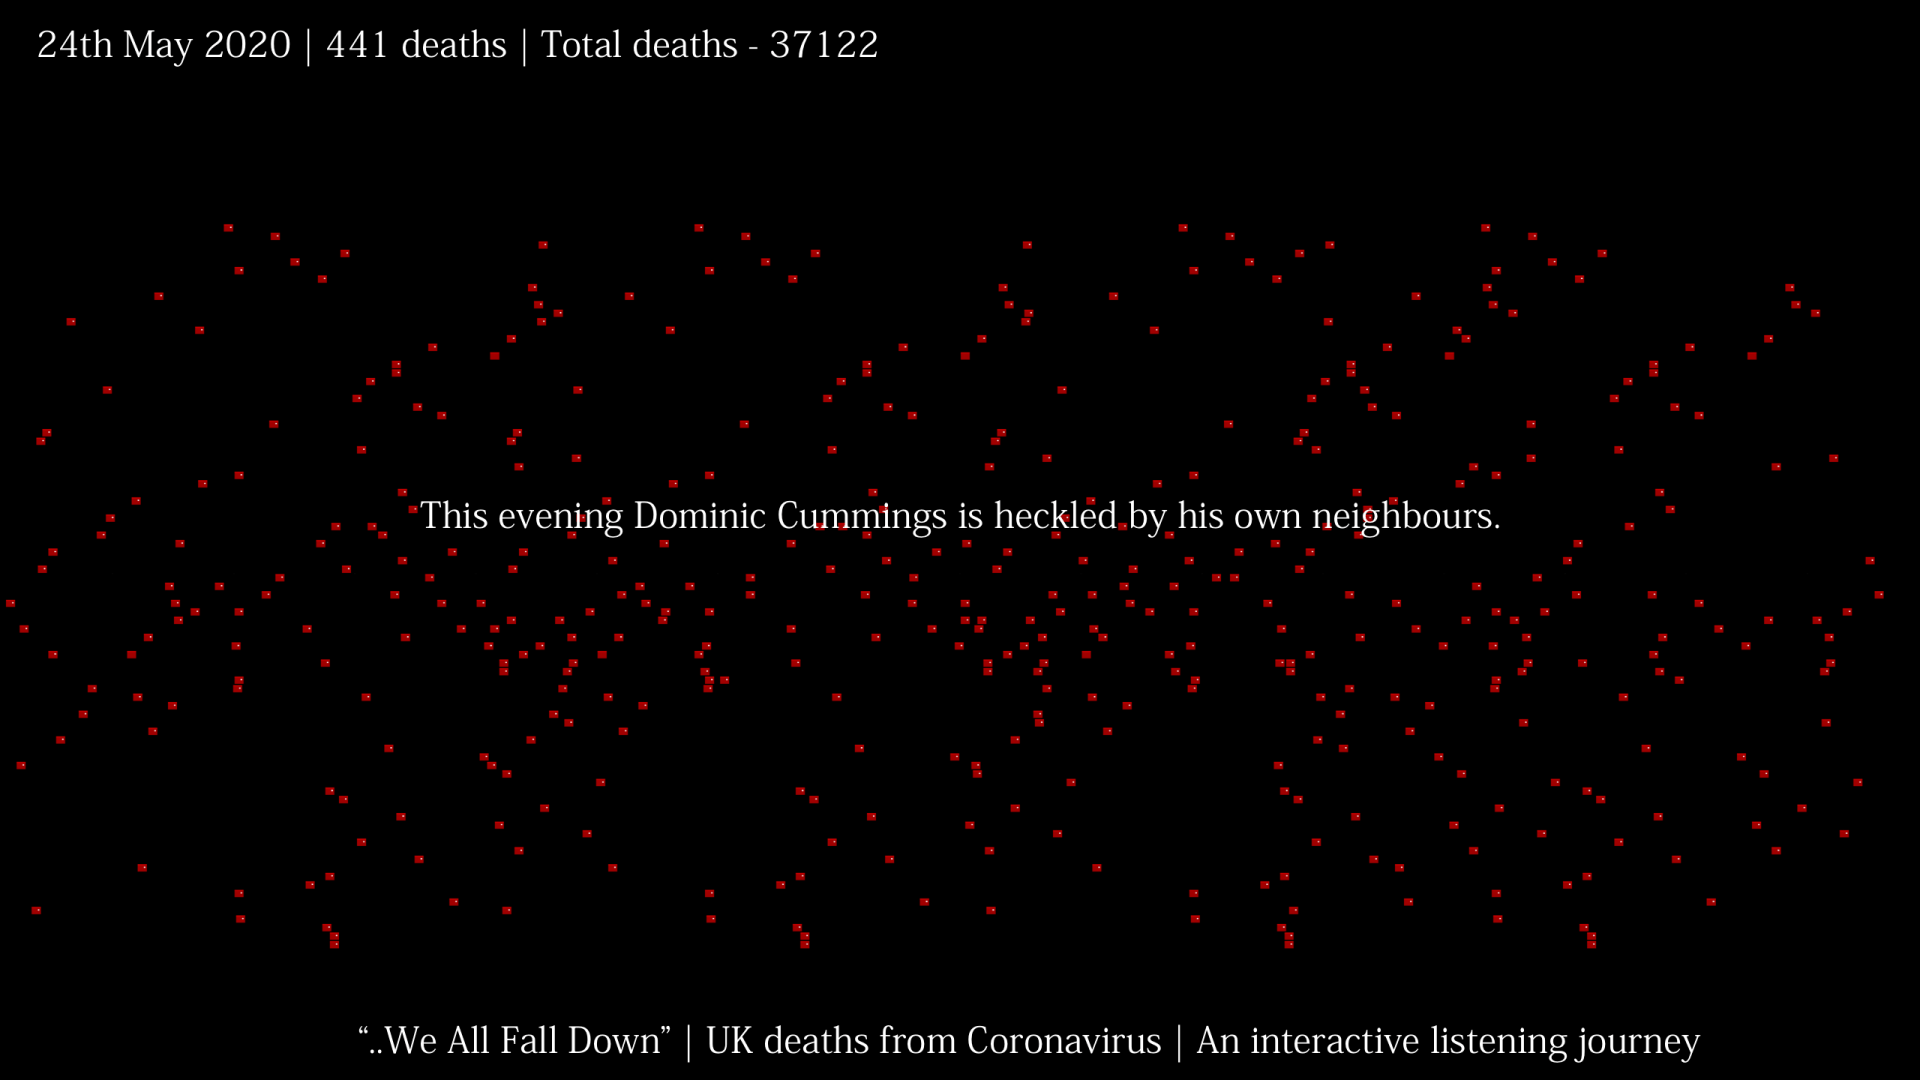
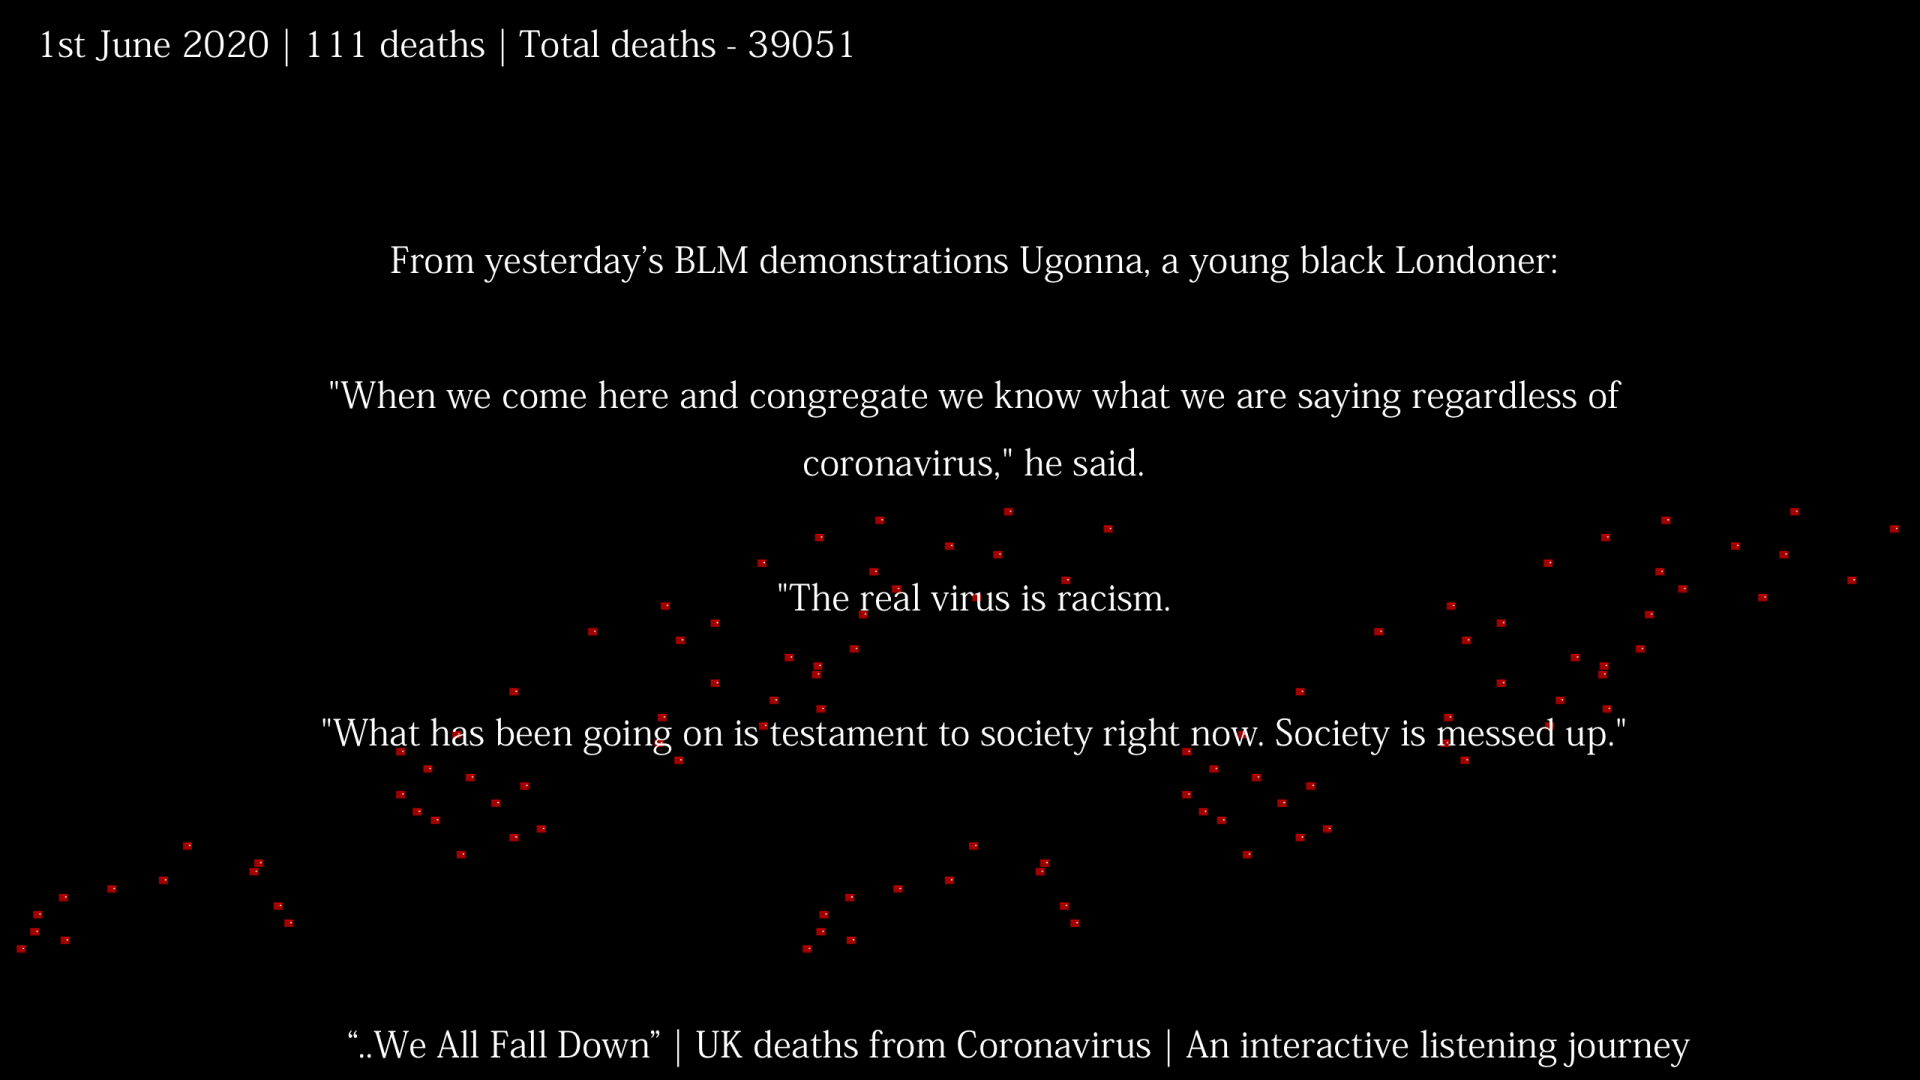
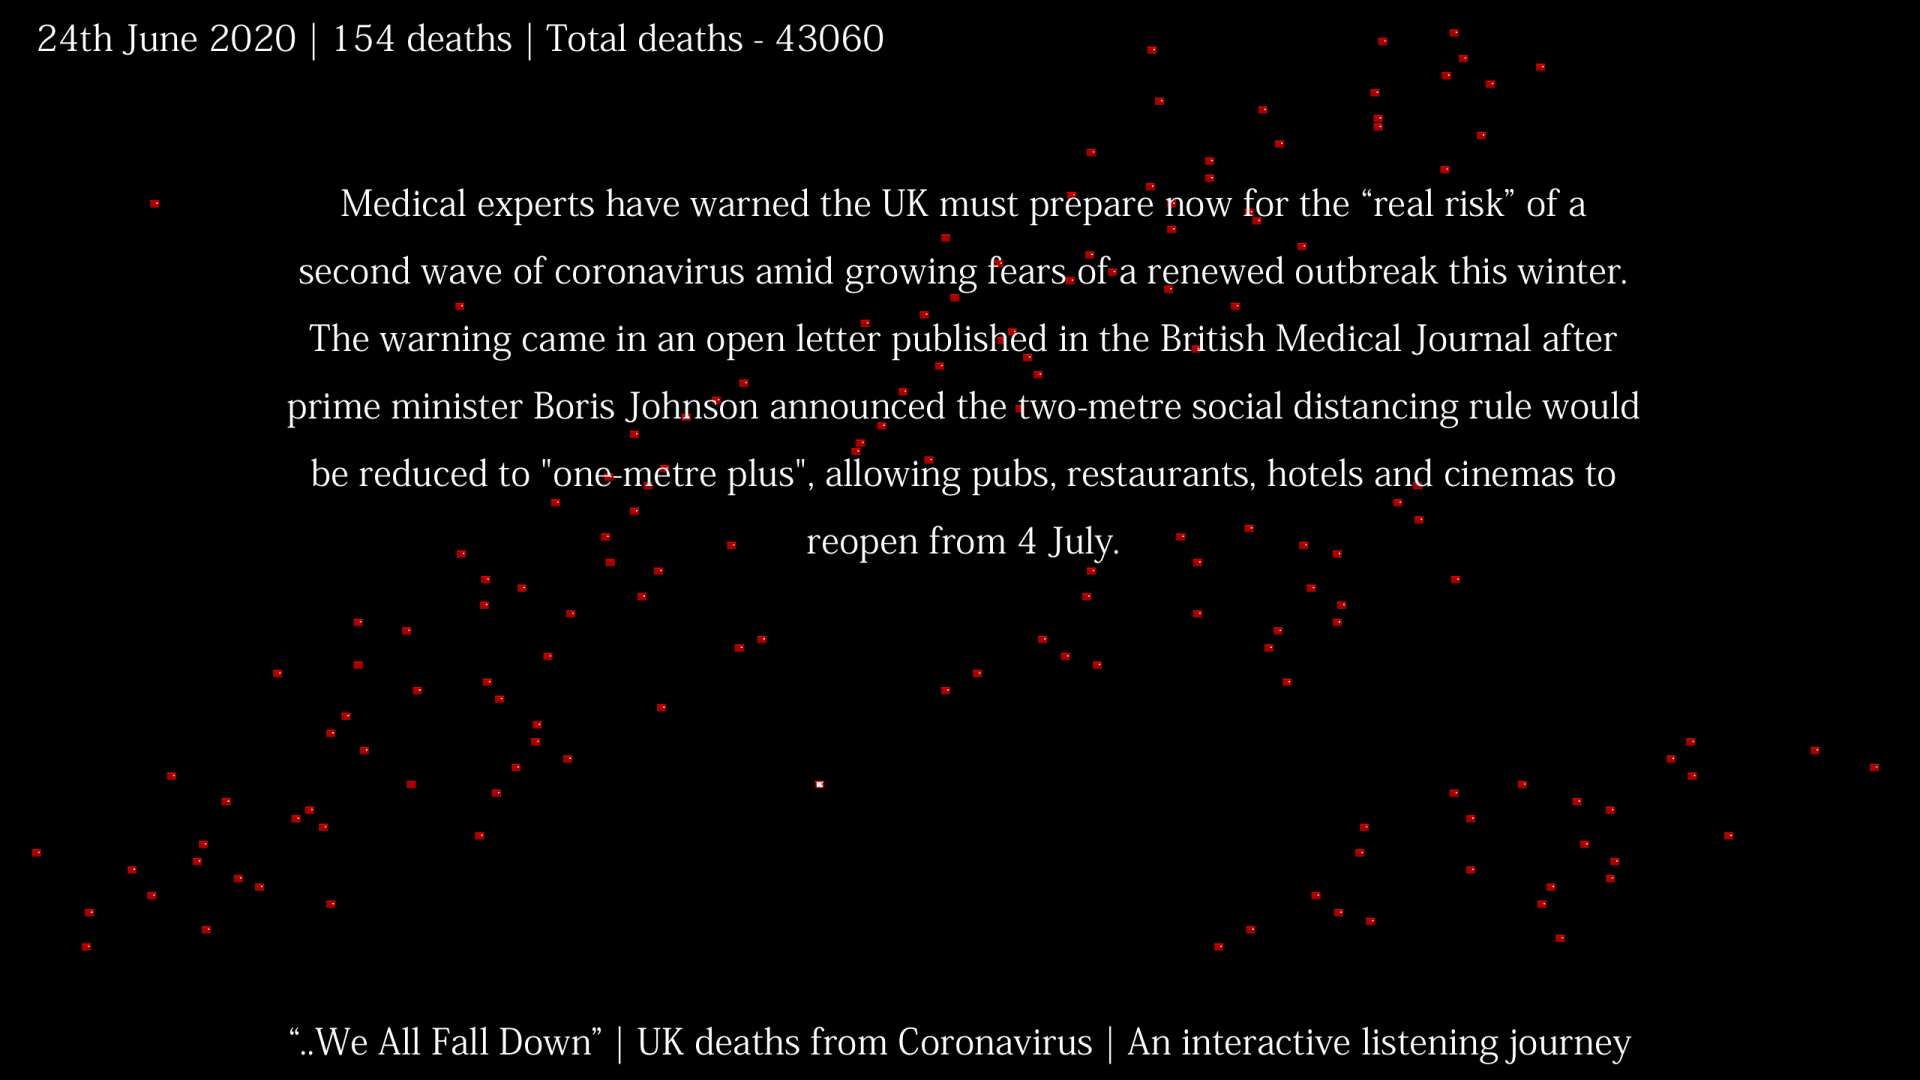
Every sound you hear represents one death from Covid 19 in the UK.
Every 30 seconds represents the timespan of one day, starting from the day of the first recorded death on March 5th.
Refer to Jamie Perera | Covid 19 Sonification #2 | Timeline and sources
as you listen.
Statement on Sonification (June 2020):
In this process I collect and catalogue news and media on the days they happen, and represent each death with fragments of audio from these stories.
At the time of update there were 42,927 UK deaths as on gov.uk. To represent each with a single sound has taken 55 minutes. The true estimated figure from ONS excess deaths was nearer 64,000.
I am now unmistakably in the thoughts of ‘how’, ‘why’, and ‘who’. But my main wish is to respectfully represent those who have lost their lives. I am interested in honest responses and I hope this work engages us to reflect on what has happened and is still happening around us.
Sonification - England Covid 19 Deaths by Day from March 1st - Updated June 12th 2020
England's Covid 19 Deaths By Day - Harmonic sonification.
Listen while viewing the following visual: bit.ly/Covid19_Chart. Sonification helps us both factually and emotionally understand events by listening to associated data.
For England's journey with Covid 19 I'm sonifying the following data for deaths in England from March 1st 2020:
> Kick drum - Day Markers (from 0.00)
> Reverse cymbal - National Lockdown Mar23rd (1.24)
> Cello - Daily Hospital Deaths (from 1.44)(red dots on chart)
> Synth Pulse - Hospital Deaths 5 day Rolling Average(from 0:08)(blue line on chart)
> Strings - All Settings Deaths 5 day Rolling Average (deaths in all places)(from 0:20)(green line on chart)
> High Violins - Excess deaths (the total amount of deaths above the 5 year average)(from 0:52)(grey blocks on chart)
Data for this sonification was collated by Thom Alex Day from the following sources:
www.england.nhs.uk/statistics/stat…9-daily-deaths/
www.ons.gov.uk/peoplepopulationa…inenglandandwales
Sonification programming by Adrian Lewis.
Artist’s Statement on Sonification (May2020):
Sonifying deaths from Covid 19 is not a decision I’ve taken lightly. It’s a process of emotional learning, of exploring issues whilst expressing the data responsibly; my feelings are secondary to the form being a catalyst for others to reflect on their experiences. Sonification sits somewhere between information and emotion, whilst dealing with issues like data integrity, accuracy of representation, meaning, story and agenda. So nothing is perfect, the imperfection is embodied and is subject to what arises in the process of making. For my part, it’s impossible to not have thoughts of ‘how’, ‘why’, and ‘who’, as more facts are researched and as more data is pored over. But right now, the overriding feeling is to respectfully represent those who have lost their lives. I am interested in honest responses and I hope this work engages us to reflect on what has happened and is still happening around us.